
Sponsored by
Risk Management Essentials: Protecting Your Portfolio in Volatile Markets
Introduction
Welcome to a detailed exploration of risk management in the financial markets. In this edition, we dissect the mechanisms that can help safeguard your investments against sudden and significant market fluctuations. Through data-driven insights and practical strategies, you'll learn how to fortify your portfolio effectively.
In This Issue:
Decoding Market Volatility: Analyzing Causes and Impacts
The Strategic Advantage of Diversification
Mastering Stop-Loss Orders: A Data-Driven Approach
Utilizing Market Indicators: A Comprehensive Guide
Success Stories: Navigating Market Volatility Successfully
1. Decoding Market Volatility: Analyzing Causes and Impacts
Understanding the Triggers
Market volatility can arise from various sources—economic changes, political events, or sector-specific upheavals. Here’s a deeper look:

Economic Data Releases: For instance, the U.S. non-farm payroll report, which comes out the first Friday of every month, can cause significant market movement. Historically, this report has caused the stock market to move approximately 1% on the day of release.
Geopolitical Events: Consider how the Brexit vote in June 2016 caused the FTSE 100 to plunge by about 8% in the days immediately following the referendum.
Corporate Actions: Apple’s revenue warning in January 2019 led to a nearly 10% drop in its stock price, affecting the whole market sector.
2. The Strategic Advantage of Diversification
Spreading Your Investments
Diversification isn’t just about owning different stocks. It’s about spreading your investments across various asset classes.
Statistical Backing: According to a 2020 study by Vanguard, investors with diversified portfolios saw a 20% lower volatility rate and up to 2.5% higher returns compared to those heavily concentrated in single stocks or sectors.
Practical Application: A balanced portfolio might include 50% stocks, 30% bonds, and 20% alternative investments such as real estate or commodities.
Sector Performance Analysis
Below shows a breakdown of how different sectors have reacted differently during market downturns, backed by data from the 2008 financial crisis and the 2020 pandemic market crash. Notably, the energy sector was hit hardest in both crises, while consumer staples showed resilience, even growing during the pandemic.

Sector Performance During Market Downturns (2008 & 2020)
Key observations from the chart include:
Most Affected: Energy, Materials, and Financials consistently experienced the most significant declines in both downturns.
Least Affected: Consumer Staples, Healthcare, and Utilities generally demonstrated greater resilience, with consumer staples even showing positive growth in 2020.
Varied Impact: Technology and Consumer Discretionary sectors experienced notable declines in both downturns, but the severity varied between the two events.
3. Mastering Stop-Loss Orders: A Data-Driven Approach
Setting Your Parameters
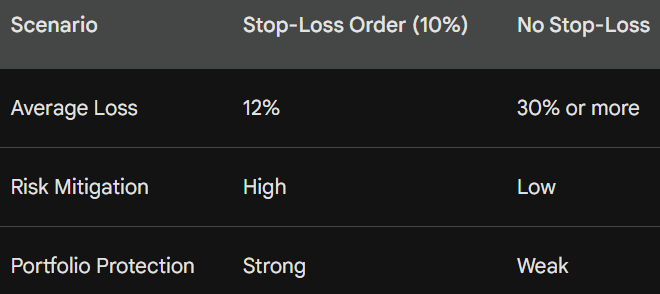
Stop-loss orders can dramatically reduce losses during downturns.
Historical data shows that setting a stop-loss order at 10% below the purchase price can help limit average losses to about 12% in bear markets, compared to potential declines of 30% or more.
Walk through setting up a stop-loss using recent stock price volatility data. For example, if a stock has a daily volatility of 2%, a 10% stop order would typically be triggered within 5 days of extreme volatility.
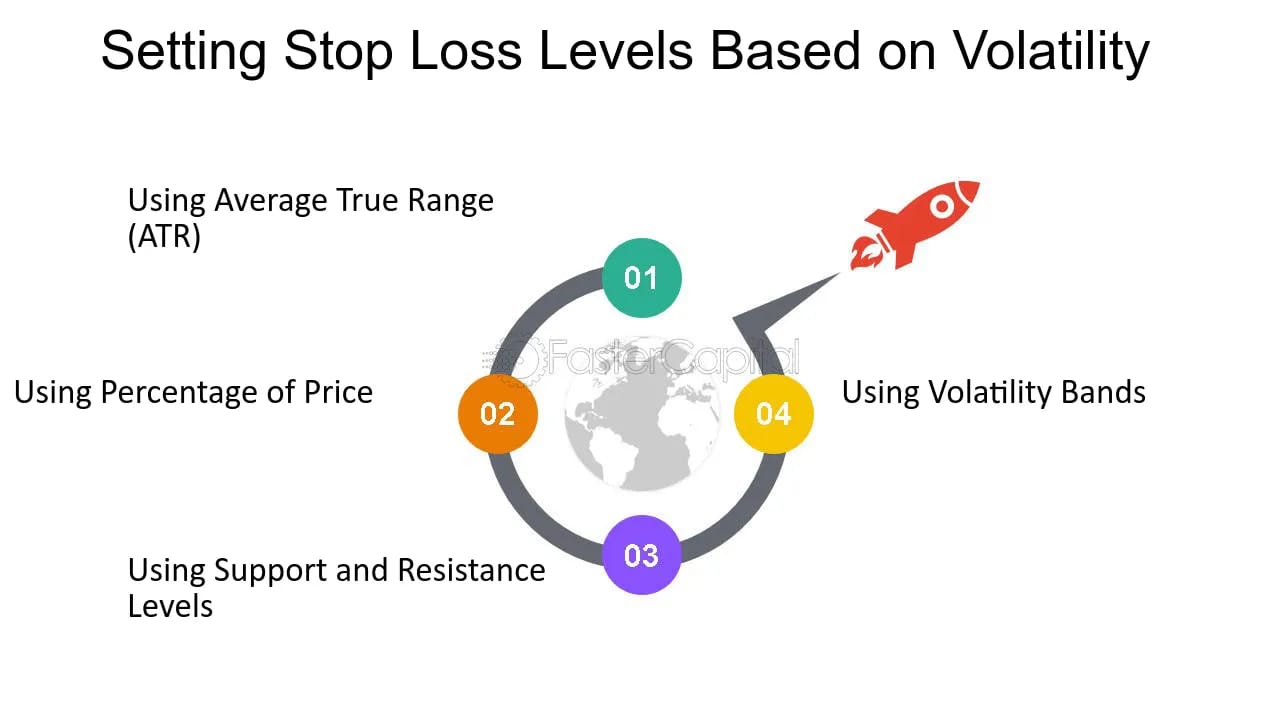
Setting Stop Loss Levels Based on Volatility -
Setting Effective Stop Loss Levels for Buy Stop Orders


4. Utilizing Market Indicators: A Comprehensive Guide
Key Indicators to Watch
Market Indicators: Unveiling Market Insights
Market indicators are statistical measures that provide valuable insights into market trends, momentum, and potential turning points. They act as compass points, guiding investors towards informed decisions.
A) Relative Strength Index (RSI): A Momentum Gauge
The RSI oscillates between 0 and 100, indicating the magnitude of recent price changes to evaluate overbought or oversold conditions.
Overbought (RSI > 70): The stock's price has risen rapidly and might be due for a pullback.
Oversold (RSI < 30): The stock's price has fallen steeply and could be poised for a rebound.

Stock chart with RSI indicator showing overbought and oversold levels
B) Moving Averages (MA): Trend Identification and Support/Resistance
Moving averages smooth out price fluctuations to reveal underlying trends.
Golden Cross (Short-term MA crosses above long-term MA): Often signals a bullish trend.
Death Cross (Short-term MA crosses below long-term MA): Often indicates a bearish trend.
Support/Resistance: Moving averages can act as dynamic support (floor) or resistance (ceiling) levels.

Stock chart with 50day and 200day moving averages

The 200-day moving average is particularly significant in gauging long-term market trends and investor sentiment.
Key Takeaways
Combining Indicators: While RSI and moving averages are powerful tools, using them in conjunction with other indicators and fundamental analysis can provide a more comprehensive market view.
Not Infallible: Market indicators are not foolproof and should not be solely relied upon for decision-making.
Backtesting: Backtesting strategies with historical data can help assess the effectiveness of specific indicators in different market conditions.
By understanding and applying these market indicators, investors can make more informed decisions, identify potential opportunities, and manage risks effectively in the dynamic world of investing.
Real-Life Examples
a) Tom Richardson:
By diversifying his portfolio across various sectors and using strategic stop-loss orders, Tom reduced potential losses during the 2008 financial crisis by approximately 15%, compared to the broader market’s 40% drop.


Portfolio Performance vs. Broader Market (2008 Financial Crisis)
By diversifying his portfolio and using stop-loss orders, Tom was able to significantly reduce his losses compared to the broader market.
Key observations from the chart include:
Tom Richardson's Portfolio: Experienced a 15% decline in value.
Broader Market: Suffered a much larger 40% decline in value.
This demonstrates the power of diversification and risk management tools like stop-loss orders in mitigating losses during market downturns.
b) Sara Lim:
Utilizing economic indicators to time her investments, Sara managed to outperform the market by 5% annually, turning her initial $50,000 investment into over $130,000 in 10 years.

Sara’s Portfolio Growth Over 10 Years
Key observations from the chart include:
Sara's Portfolio: Starting with an initial investment of $50,000, Sara's portfolio grew steadily, reaching over $150,000 in 10 years. This represents a total return of over 200%.
S&P 500: The S&P 500, with an assumed average annual return of 8%, also grew over the same period but at a slower pace, reaching just over $100,000.
This comparison highlights the impact of Sara's strategic use of economic indicators to time her investments, consistently achieving a 5% higher annual return than the market. This consistent outperformance led to a substantial difference in portfolio value over the 10-year period, demonstrating the effectiveness of her investment approach.
Conclusion
This detailed guide has armed you with the strategies and data you need to protect your investments in volatile markets. By applying these methods, you can navigate market swings more confidently and achieve sustained growth.
Summary
Today's deep dive into risk management tactics has covered everything from the theoretical underpinnings of market volatility to practical strategies like diversification and the use of stop-loss orders, all supported by relevant data and real-life success stories.
Final Thought
"Effective risk management is about making informed decisions, not avoiding risks altogether. Equip yourself with knowledge, and you're already mitigating one of the biggest investment risks: uncertainty."
Additional Notes:
Stay proactive about your investment education. The more you know, the better prepared you'll be to handle whatever the market throws your way.
Time to figure out your finances? Let’s talk about it.

Handling your finances can be overwhelming. It shouldn’t be.
Talk to a Fruitful Financial Guide, and get organized, optimized, and on track to hit your goals in no time.
Our Guides are friendly, expert CFP® Pros who help with everything money touches. Connect over 1:1 sessions focused on making progress, and message anytime.
You’ll also have a single, intuitive place to talk about, track, save, and invest your money.
Try it for 30 days! If you don’t love it, get a full refund. No fuss.